

Stadiumville and deep maps
02 December 2014 – Brennan Collins
What happens when you layer an art experiment on top of a science project on top of a walking tour on top of an archival map on top of demographic data on top of a memoir? What if the archives of multiple universities could be accessed on one platform and layered with the projects, stories, and data from researchers, teachers, students, and community groups?
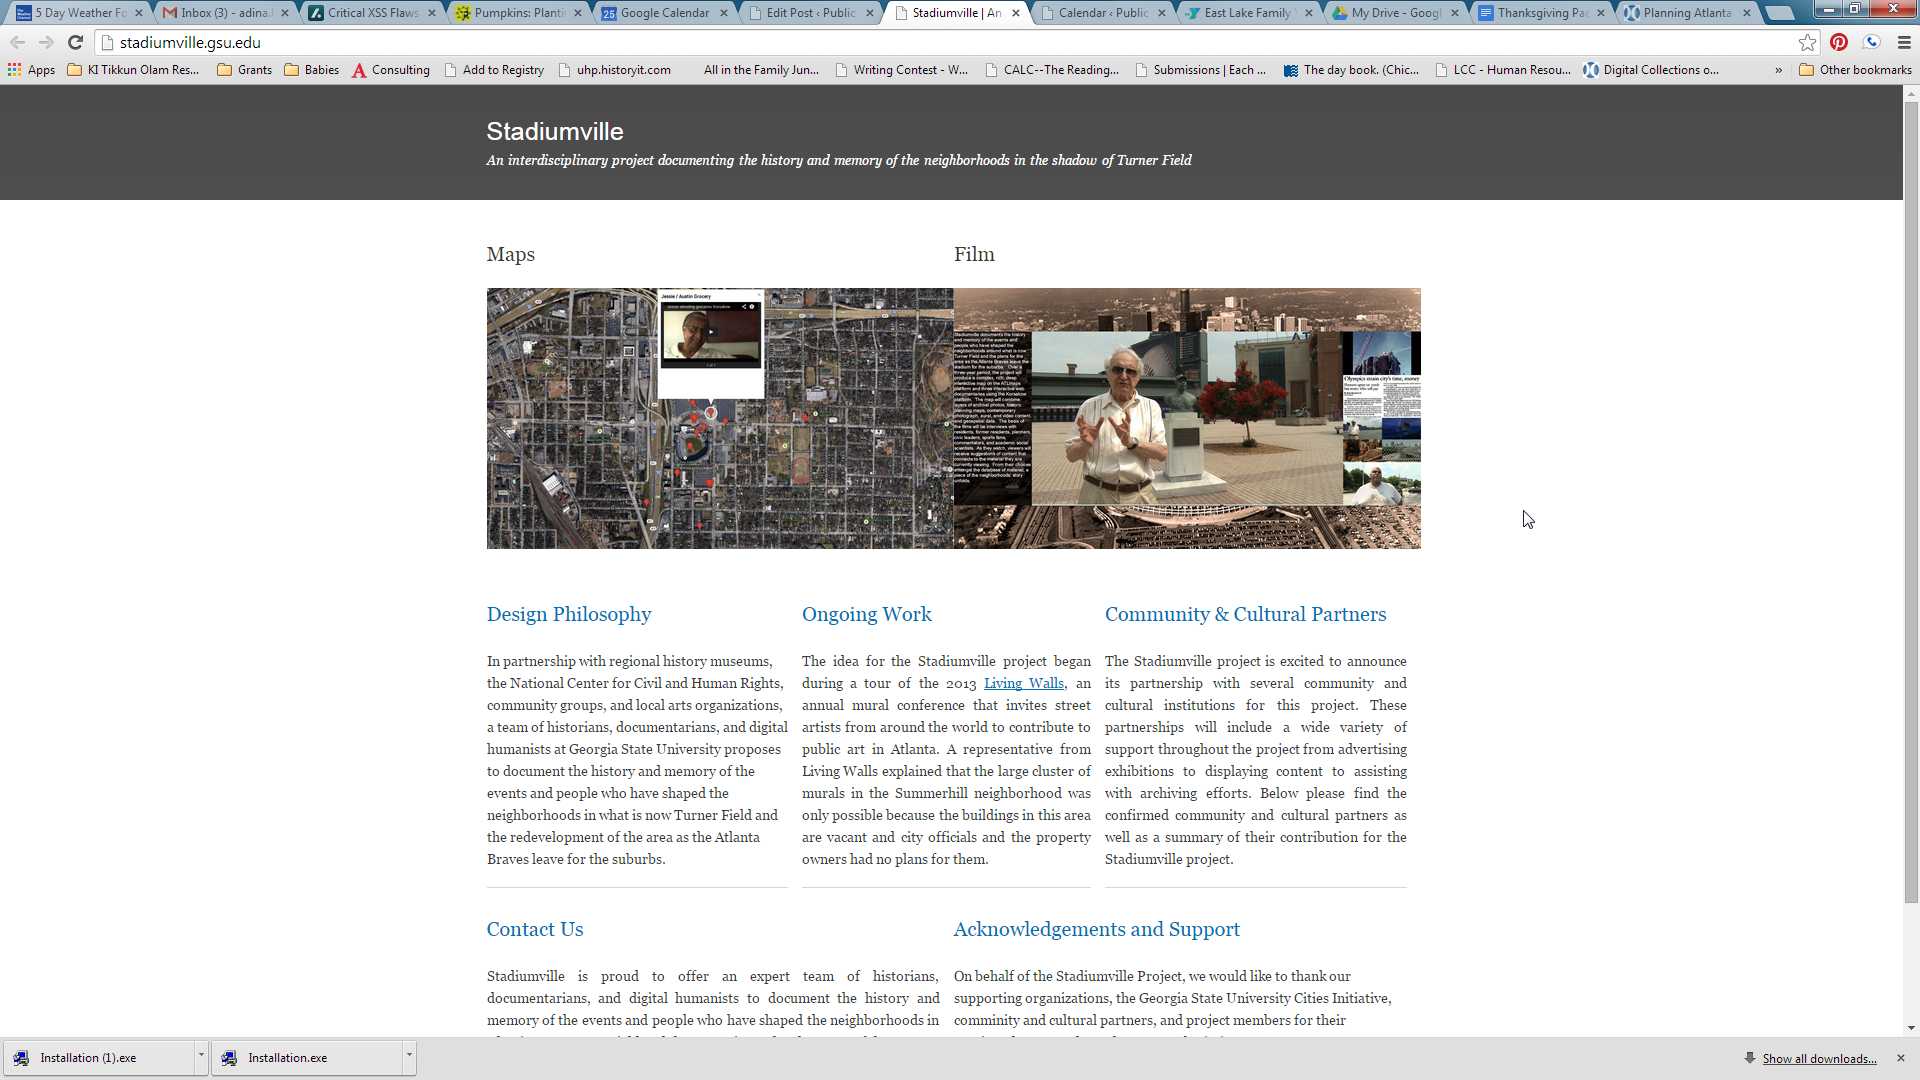
Stadiumville project site as of November 25, 2014. Screenshot credit: Adina Langer
The concept of deep mapping comes from a literary tradition focused on interdisciplinary exploration of small rural areas, but new technologies in GIS and database-driven visualization tools now allow for incredibly rich explorations of cities. The Polis Center, based on its National Endowment for the Humanities (NEH) summer institute on deep mapping, defines the concept considering these new possibilities:
A deep map is a detailed, multimedia depiction of a place and all that exists within it. It is not strictly tangible; it also includes emotion and meaning. A deep map is both a process and a product – a creative space that is visual, open, multi-layered, and ever changing. Where traditional maps serve as statements, deep maps serve as conversations.
Collecting and presenting “all” of the stories of a place–in this case, the city of Atlanta–is not a fully attainable goal, but it is a guiding principle for ATLmaps, a deep mapping platform currently under development by Georgia State and Emory University to create “conversations” by layering stories and data about Atlanta. Stadiumville started as a simple example of what the ATLmaps platform could do and has turned into a potential three-year documentary project on the past, present, and future of the neighborhoods surrounding the Atlanta Braves’ stadium, Turner Field.
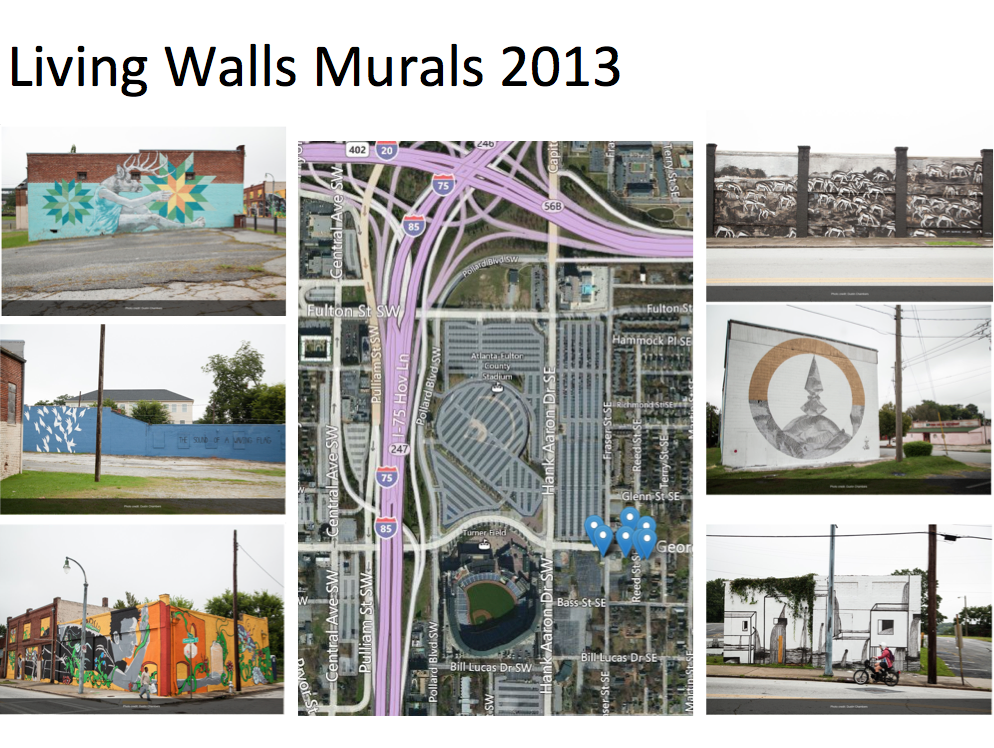
The Stadiumville documentary project began during a bike tour of an annual mural project called Living Walls, which brings street artists from around the world to cover walls around Atlanta. In the Summerhill neighborhood, the site of Turner Field, the tour guide explained that the organization was allowed to cover all the walls of a cluster of unused commercial buildings because the city and property owner had no objections. This unusual permission was not because the area is an up and coming arts district but because the business area has been almost completely destroyed or abandoned because of interstates, stadiums, and parking lots.
Screenshot credit: Brennan Collins
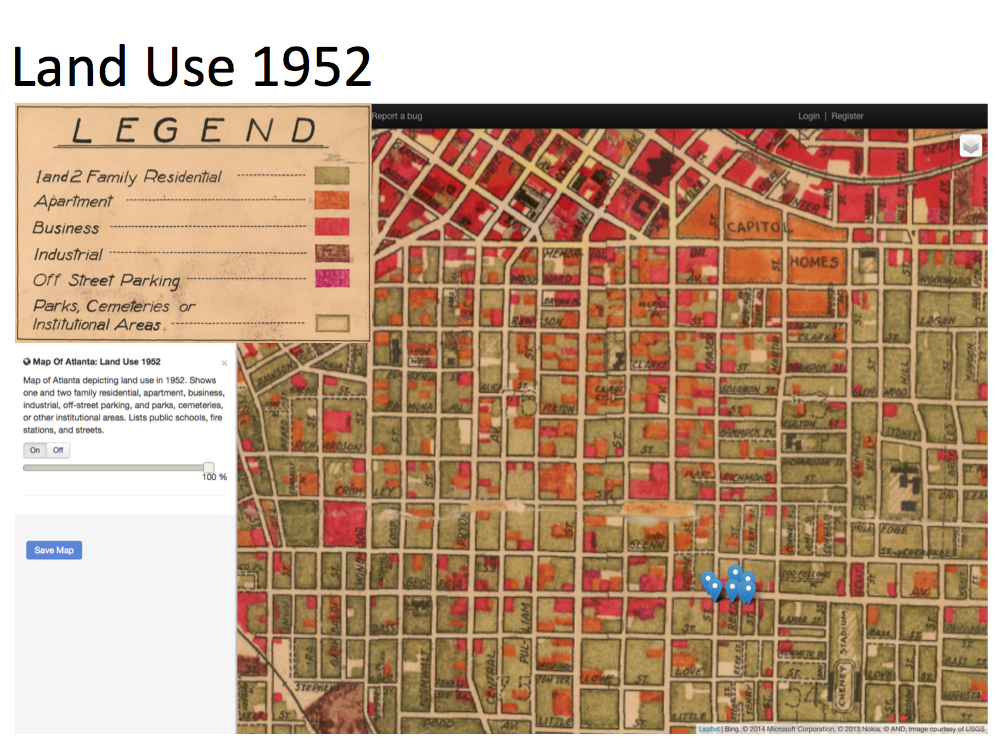
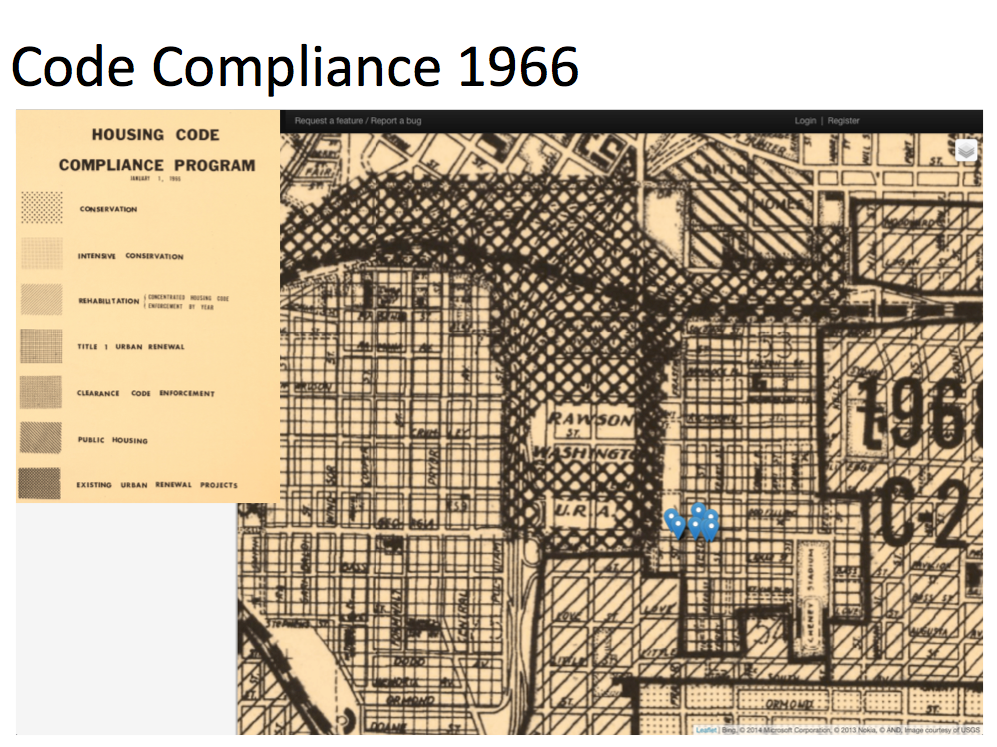
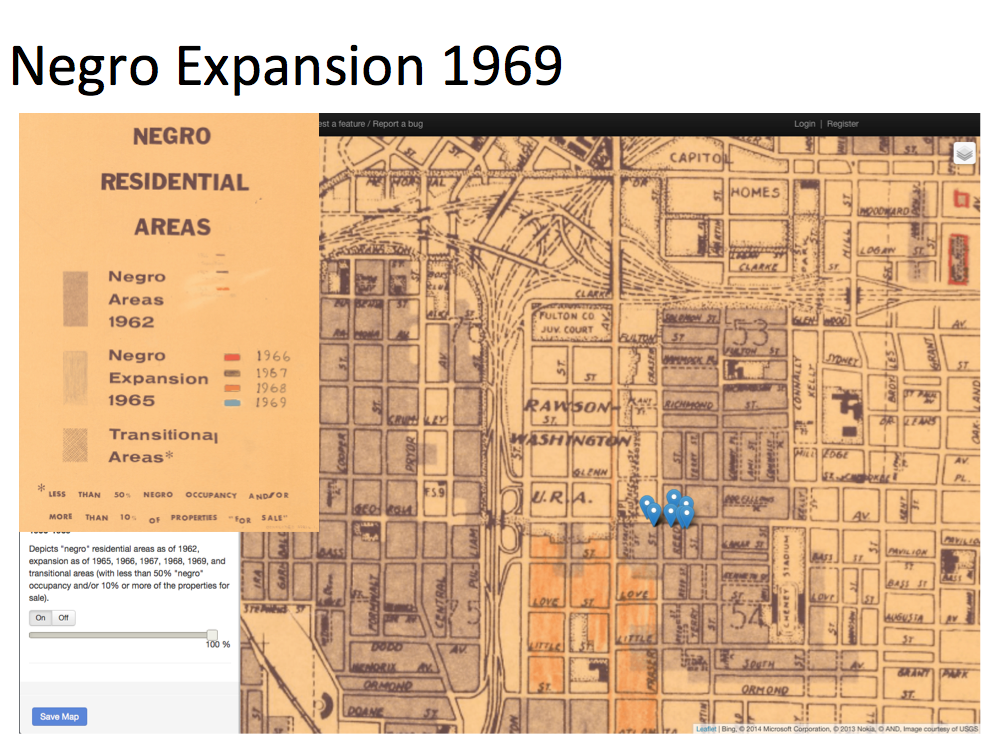
The connection between a 2013 mural project and the urban renewal plans from decades before became one of the first examples to demonstrate the potential of our platform. Living Walls allowed us to scrape their location data for all of the murals. We then searched Georgia State University Library’s Planning Atlanta: A New City in the Making collection for relevant archival maps and quickly found three that helped tell the story of this area–a 1952 land use map, a 1966 code compliance map, and a 1969 “Negro Expansion” map.
Screenshot credit: Brennan Collins
Screenshot credit: Brennan Collins
Screenshot credit: Brennan Collins
Layered together, these maps show that as African Americans moved into the area, a densely populated neighborhood was transformed, using federal urban renewal funds, into a sparsely populated area with a stadium and massive parking lots.
Soon after we put our map together, the Braves announced they would be leaving Turner Field to move to the suburbs. We knew we had a larger project on our hands and started setting up interviews.
For our deep map of Stadiumville, we will continue to collect and curate a growing number of projects on the past, present, and future of the area–art projects; news reporting; archival maps and photos; oral histories of the Black, Jewish, and white Christian communities; census information; future and never implemented redevelopment plans; environmental studies; social media data; and housing and economic reports. Our audience, whether they be scholars, community members, students, or politicians, can explore how all of these layers interact to create an emotional, cathartic experience for the viewer yet not at the expense of social data driven stats.
~Brennan Collins is the Associate Director of Writing Across the Curriculum and the Center for Instructional Effectiveness at Georgia State University. The interdisciplinary nature and technology focus of these programs allows him to work with a diverse faculty in exploring inventive pedagogies. He is particularly interested in using maps in and out of the classroom to develop student critical thinking. He teaches courses on graphic novels and African American and Multi-Ethnic US literatures.
1 comment