

Digital Urban History: A Survey of the Field
06 July 2021 – David Hochfelder
In 1929, the city of Evanston, Illinois physically moved Lucious Sutton’s house about a mile and a half. His family was one of seven African American families on a block who were living in an area that a 1921 zoning law had set aside for whites only. To address this injustice, the city recently passed a community reparations resolution. Asheville, North Carolina also did so to mitigate the effects of discriminatory housing practices like redlining, urban renewal, and gentrification. Other cities, like Rochester, New York, are debating whether to follow suit. My aim here is to use these discussions about equity and reconciliation as a jumping-off point to survey the digital urban history projects that have proliferated over the past decade.
Practitioners often have trouble defining exactly what public history is. I offer three general criteria about what constitutes public history in the growing field of digital urban history. First, many projects profiled here engage with concrete, real-world issues like discriminatory housing practices. Furthermore, these sites employ research and dissemination techniques familiar to public historians like oral history, photography exhibits, digital publications, and social media. Finally, good public history tells compelling narratives. In this sense, the projects surveyed here are not spatial history tools, but, instead, they offer resources and platforms to create public-facing projects.
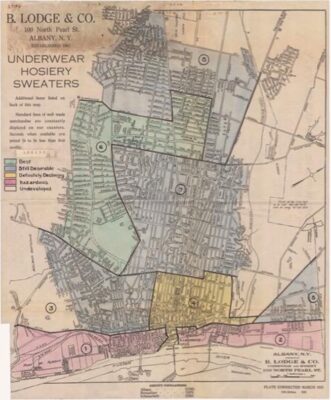
Draft Residential Security Map (1936), Albany, New York. Courtesy of the National Archives, College Park, MD.
Early efforts at digital urban history began as companions to scholarly books. While they are not public history projects as I define the term, these sites did set the model for subsequent public history work in digital urban history. Colin Gordon’s Mapping Decline supplements his 2008 book by the same title. It uses a set of map layers that capture change over time and also provide information about relevant documents and other primary sources. Stephen Robertson’s Digital Harlem serves as a place-based repository of primary documentation such as police reports and newspaper accounts, and pairs with his coauthored 2010 book Playing the Numbers: Gambling in Harlem between the Wars. His blog explains how to use this site in the classroom and for further research. Finally, Emily Thompson’s Roaring Twenties project maps noise complaints to reproduce the soundscape of New York City during the 1920s. She intended it to pair with her award-winning book The Soundscape of Modernity: Architectural Acoustics and the Culture of Listening in America, 1900-1933. Her site went live to great fanfare in 2013, including coverage from NPR and Pitchfork. Unfortunately, the site is a cautionary tale in using proprietary software—it is no longer accessible because it was authored in Flash, which is no longer supported. [Editor’s note: An update to the site is in progress and the beta version is currently available.]
The University of Richmond’s Digital Scholarship Lab has published a variety of spatial history projects at its American Panorama site. Two of the projects are especially useful for urban public historians: Mapping Inequality and Renewing Inequality. I have used material from both sites in community presentations on redlining and urban renewal. The first site covers the history of redlining, the federally sanctioned practice of mapping neighborhoods according to perceived lending risk. In the 1930s, the Home Owners Loan Corporation, an arm of the federal government, created so-called Residential Security Maps for every American city with a population of at least 50,000. These maps shaped mortgage lending patterns for decades with devastating consequences for communities of color. The heart of this site contains these maps for about 250 cities, including neighborhood descriptions. The site also allows users to download map images, georectified (vectorized) maps, shapefiles, and neighborhood descriptions.
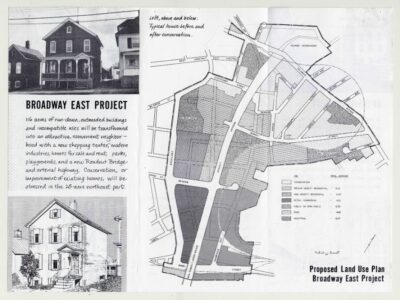
Brochure promoting urban renewal in Kingston, New York, undated, ca. early 1960s. Courtesy of the M.E. Grenander Department of Special Collections and Archives, University at Albany, SUNY.
The Renewing Inequality project makes a direct connection between redlining and subsequent federally-funded urban renewal projects. Redlining created a self-fulfilling prophecy. The denial of mortgage lending and homeowner’s insurance in particular neighborhoods starved them of capital. When city officials began urban renewal projects, they often defined these areas as “blighted” and in need of wholesale clearance. Renewing Inequality directly makes this connection by allowing users to layer redlining maps over urban renewal maps for several hundred cities. The site provides excellent data visualization that gives the numbers of families displaced for a particular project broken down by race, the geographic footprint of the project, and maps overlaying 1960 census data on poverty and the 1930s redlining map for the area. The site’s introduction offers a scroll story that humanizes and contextualizes this massive federal program, including video interviews of displaced residents, photographs of people being forcibly removed from their homes, and architectural drawings depicting futuristic landscapes that promised to replace old neighborhoods.
The sites discussed so far visualize data in interesting ways. A shortcoming of these sites, however, is that they don’t provide much guidance about how to use this information to create narratives. That is not their goal, of course. Consider them resources or jumping-off points to start that process.
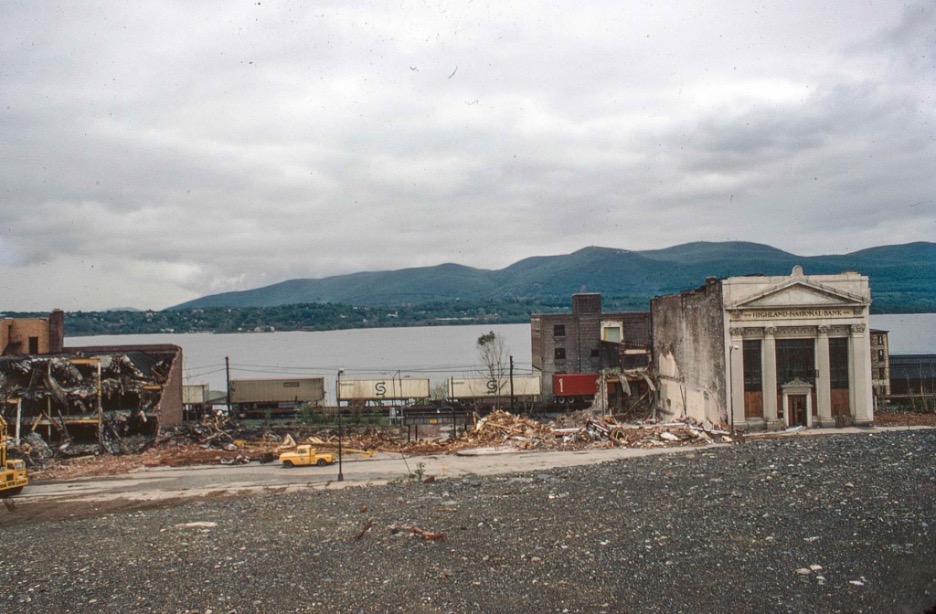
Clearance for urban renewal in Newburgh, New York, late 1960s. Courtesy of Tom Daley and the Historical Society of Newburgh Bay and the Highlands, Newburgh, NY.
Three sites combine maps with documents and timelines to tell the history of housing discrimination via restrictive covenants. These covenants were written into homeowners’ deeds preventing them from selling their homes to nonwhite households. They remained in force until the U.S. Supreme Court ruled in 1948 that they were legally unenforceable. Projects from three cities have been done so far: Mapping Segregation in Washington, DC, Mapping Prejudice about Minneapolis, and Segregated Seattle. Instead of using maps as data visualization tools, these three sites use maps as entry points into lived experiences. For example, Mapping Segregation in Washington, DC offers a story of the destruction of an African-American community to make way for Meridian Hill Park, intended to be used by wealthy white families.
Public-facing websites using off-the-shelf tools to tell stories of urban renewal have also proliferated in recent years. Preserving Society Hill combines a proprietary Esri StoryMap with an open-source Omeka content management system to integrate maps, photos, and oral histories to bring back to life this demolished Philadelphia neighborhood. Similarly, 98 Acres in Albany uses the WordPress blogging platform as a content management system and publishing outlet (full disclosure: I am one of the project’s principals). This site also uses off-the-shelf open-source tools created by Northwestern University’s Knight Lab, including a StoryMap and timeline.
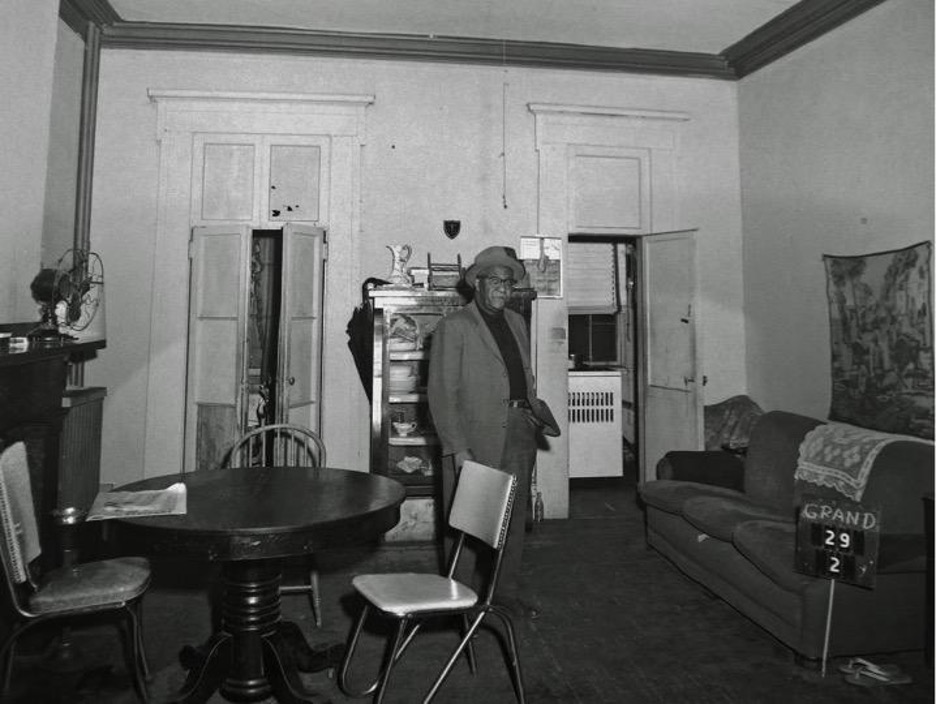
Musician Jimmy Strawn in his Albany, New York apartment before demolition for the Empire State Plaza, Jan. 11, 1963. Frank M. Walsh, photographer. Courtesy of the New York State Archives.
Omeka has proven to be a highly flexible platform that permits skilled coders to create sophisticated open-source tools. Neatline was developed at the Scholars’ Lab at the University of Virginia Library. It allows users to integrate maps, timelines, and waypoints. It has a fairly shallow learning curve and is well suited for classroom project use. Although most projects using Neatline are not urban history, strictly speaking, they are spatial in nature. An urban history (and classroom project) example is the history of the Arabian city of Jeddah.
Curatescape is another Omeka extension created at Cleveland State University. It is mainly used to create map-based responsive websites and Android and iOS phone apps like Salt River Stories about the history of Phoenix, Arizona. Curatescape is especially useful for creating historical walking tours and similar interactive projects.
The developers have placed the source code on GitHub, where it is freely available to potential users. However, most potential users, like historical societies and other underfunded public history venues, do not have staff with the technical chops to adapt the free Curatescape code for their own purposes. Ongoing support costs significant money. This is also the case with other touring platforms like Urban Archive, which at this writing only features four cities: New York City, Newburgh, and Albany, New York; and Cali, Colombia.
Digital urban history projects have only been around for about a decade. I believe that they will become more common as more tools and platforms become available. At the same time, residents have begun to ask important questions about the legacies of redlining, urban renewal, housing discrimination, environmental justice, and other ways that history has shaped today’s cityscape. As they do, the opportunity—indeed, the responsibility—for public engagement will expand dramatically.
Learning curves for using digital tools will shallow out. I expect the next decade of digital urban history work to be even more exciting than the last one.
~David Hochfelder is Associate Professor of History at the University at Albany, SUNY. Along with Ann Pfau and Stacy Sewell, he is working on an NEH-funded digital history of urban renewal in New York State.